


Shaving hours off a Pandas script
Nearly 5x Faster! And, I was able to explore Rust 🦀 and Polars 🐻❄️ with my saved time


Crunching a few hundred million lines of data
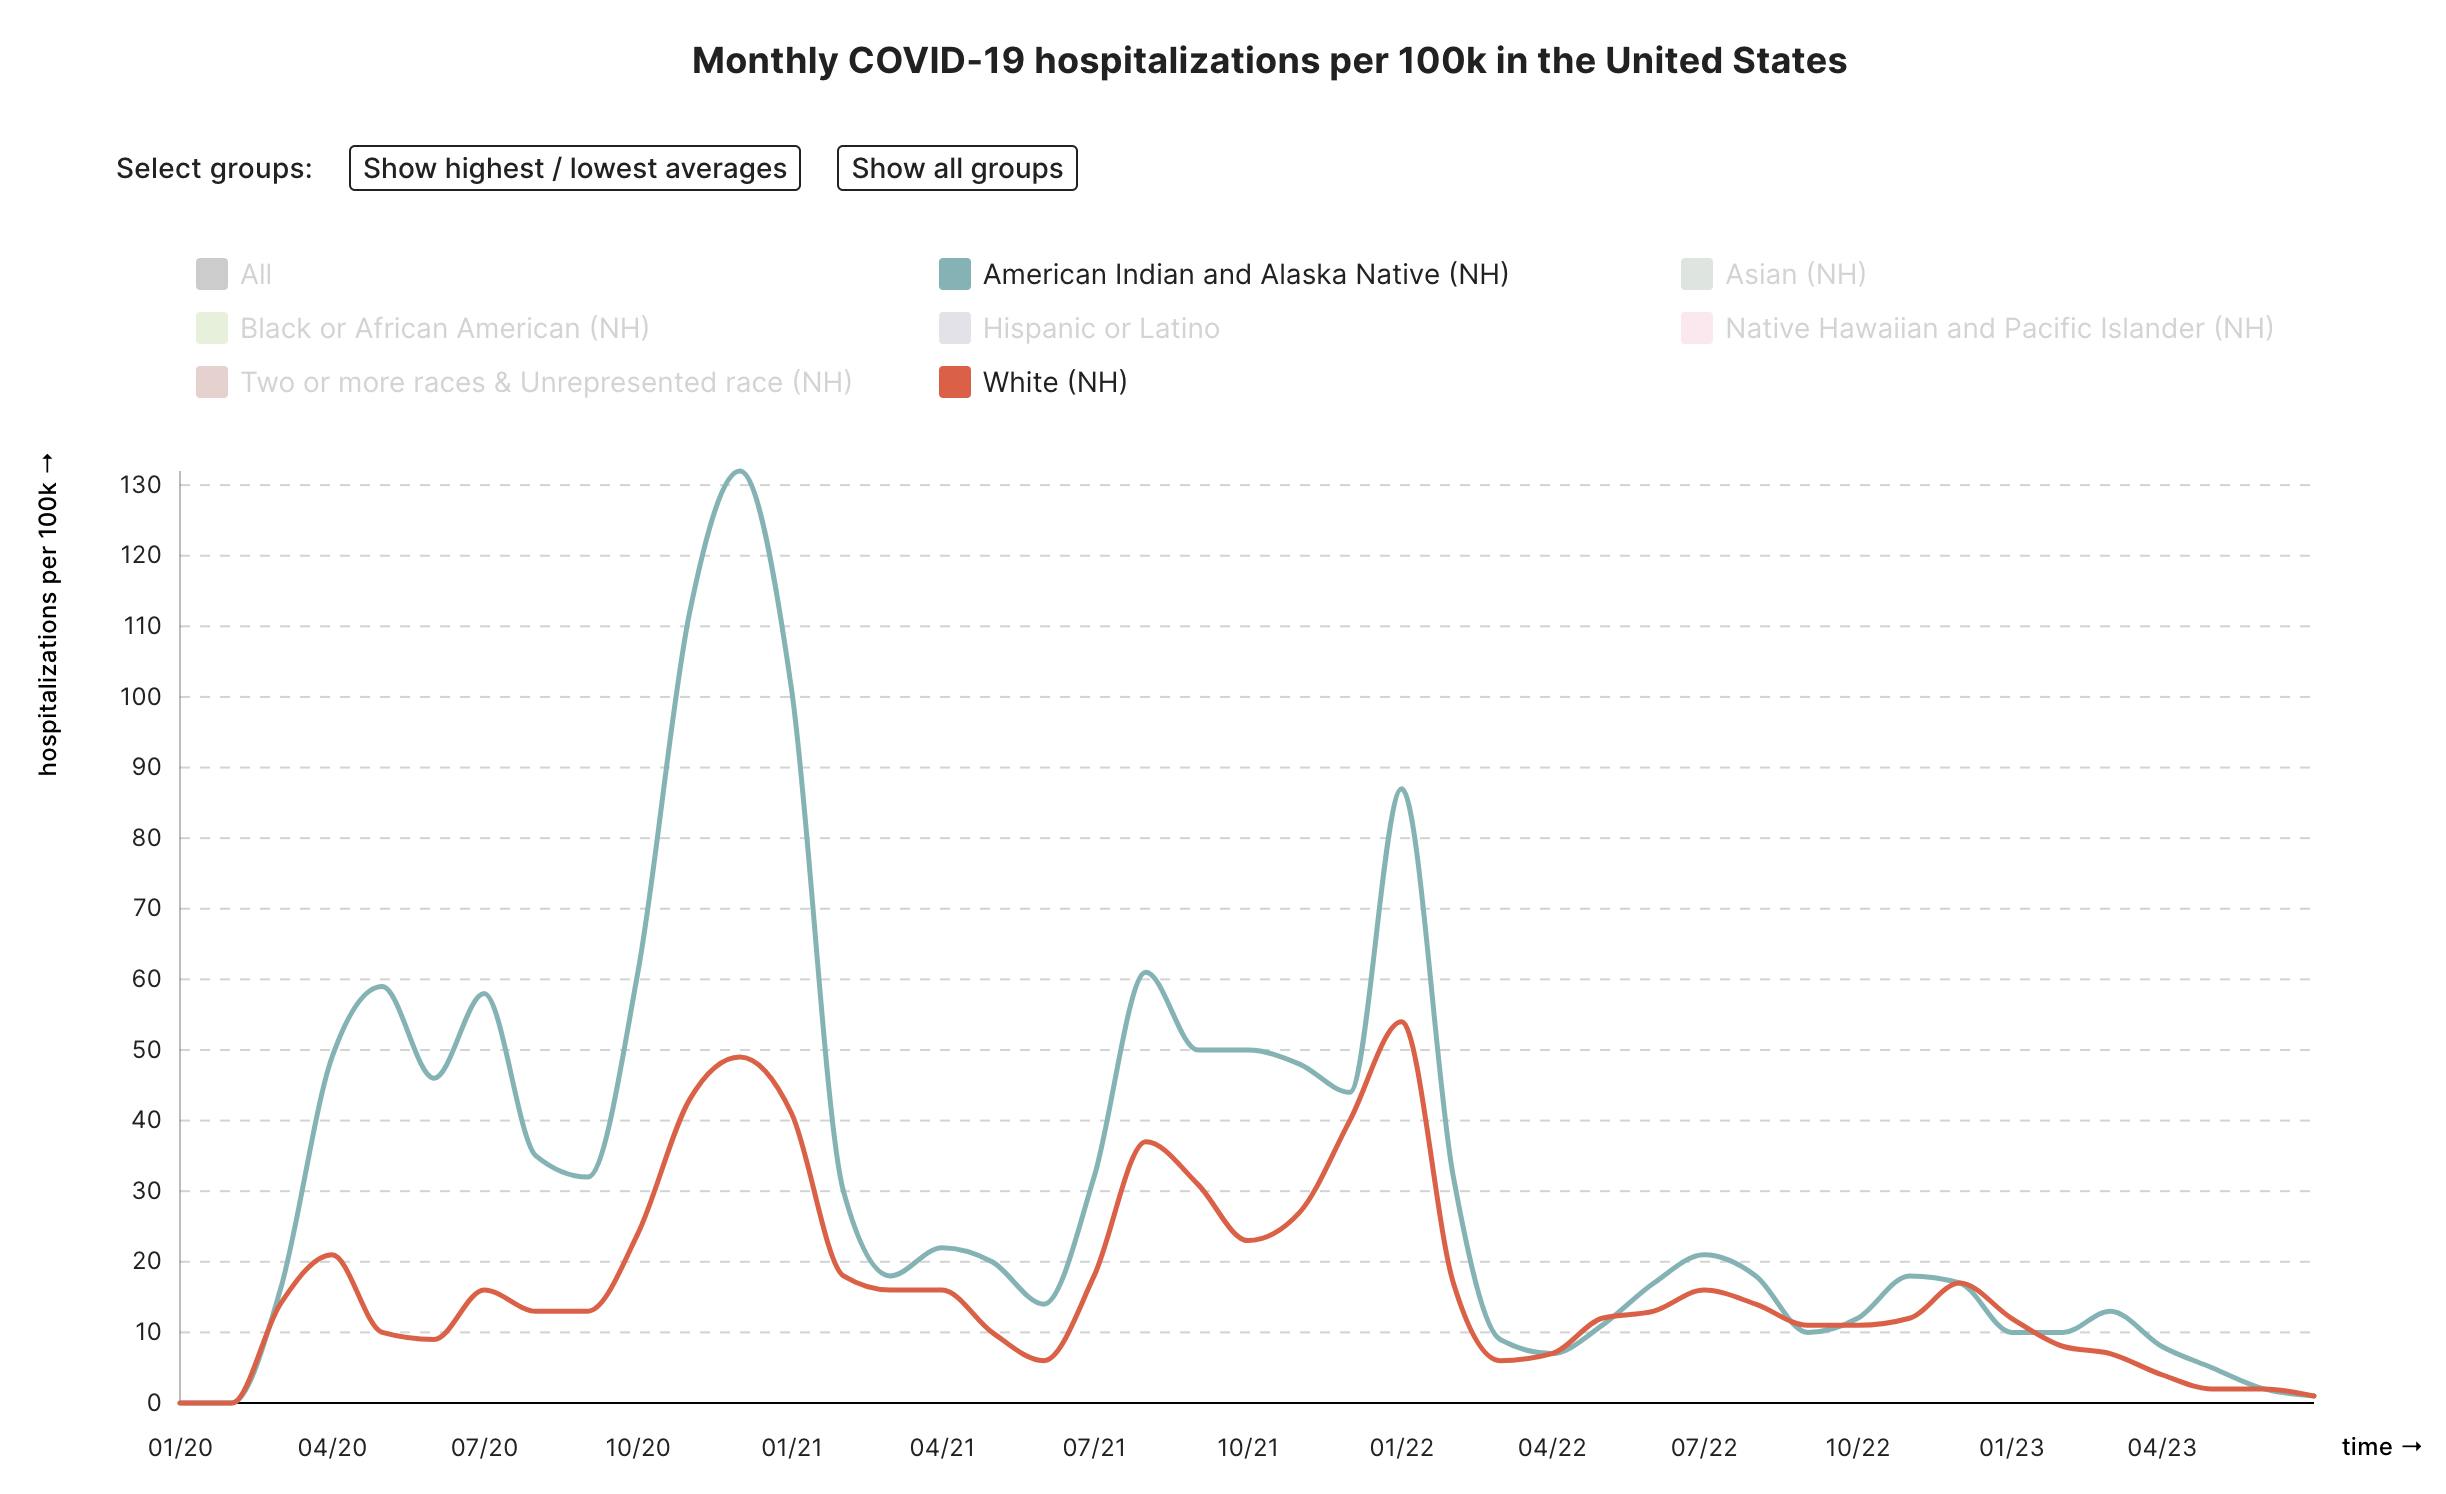
At the Health Equity Tracker, the largest dataset we work with is a case-level set provided by the CDC with every COVID-19 infection in the United States, along with additional information including race, ethnicity, county, and other symptoms. The data is provided in zipped .csv files in a private GitHub repo (due to patient privacy) and contains several hundred million rows across over a dozen files. Initially, our tracker as coded by Google.org provided only the cumulative "snapshot" of the current rates of disease outcomes by race, age, or sex to the county level.

Last year however, in a big push by our team at Morehouse School of Medicine, we were able to implement time-tracking, whereby we additionally aggregate and plot these disease rates across every month since January 2020.
As the requirements grew, so did the time it took to run the aggregation script, which needed to be done locally by an authorized team member before uploading for further processing and calculations on Google Cloud Run. The CDC releases new datasets regularly, so this entire process easily burned an entire day each month for one of our team members. After starting the script locally on my 2021 MacBook Pro, it would take nearly 3 hours to complete the aggregations.
With a few tweaks, I was able to reduce that 3-hour run-time to ~25 minutes!
Improvements
I love that our codebase is open-source, so you can check out the exact PR here, but below I'll outline the specific steps that sped things up so significantly. To benchmark, I ran the Python script against just a single raw .csv file (instead of all ~20).
Time taken by the original code to process a single file: 313s
Here are the incremental changes I made, and the improved speed measured from each step:
Two major items: Using a vectorized
combine_race_eth()function, which used Pandas' built-in optimized functions rather than mapping/applying a regular Python lambda function against each row, and only reading in the needed columns with the argusecolsin theread_csv: 191sThe above changes, plus removing some unused string manipulations meant to detect and remove empty quotes
"": 180sThe above changes, plus using
chunk_size= 1 million (using chunk size splits the df into chunks so that your machine doesn't have to hold the entire thing in memory; however my computer is fast enough to hold the entire thing so it's faster to have bigger chunks and fewer iterations. : 75sIncreasing
chunk_sizeto 2 million: 64sIncreasing
chunk_sizeto 5 million (I left the chunking in place even though thechunk_sizeeffectively doesn't use it, in case the CDC does ever ship us a file over 5 million rows, then this code will use the chunking as needed): 57s
When running against the full set of all raw files, the run time went from 2 hours and 40 minutes down to 34 minutes and produced identical output files: Nearly 5x faster!
Sanity Checks
Of the utmost importance for us as a research institution, particularly one presenting information on underserved populations, is to ensure data integrity every step of the way. To ensure my refactor didn't cause unexpected results, I implemented a "sanity check" and renamed all of the existing .csv results (produced by the old code) with the suffix _old, then wrote a quick bash script that compared every line in the _old and newly refactored results:
            for new_file in cdc_restricted_by_*.csv; do
                old_file="old_$new_file"
                if diff -q "$old_file" "$new_file"; then
                    echo "Files $old_file and $new_file are identical."
                fi
            done
To ensure the check itself was working, I also ran this diff command to compare the county_race file and the state_race file and observed hundreds of differences (as expected).
Abandoned Optimizations
The most common suggestion I found when researching Panda's optimization was to utilize the vectorized methods built-in to Pandas, rather than using .apply() to apply a lambda or function against each row of the dataframe iteratively. In some cases, like refactoring the race and ethnicity -> race/ethnicity function, this did speed up the algorithm significantly. However, there were several further vectorization optimizations I tried out that surprisingly slowed down the process and made it worse. These were all .str dataframe methods, which are a known subset of vectorized methods that can be less efficient than the Python loop-based approach.
One example of an abandoned optimization was dealing with our county FIPS codes that need to be treated as strings, complete with leading zeros (for example Denver County FIPS is 08031, which when treated as a number turns into 8,031.
The type conversion and string formatting are done in the existing code using .map():
df[COUNTY_FIPS_COL] = df[COUNTY_FIPS_COL].map(lambda x: x.zfill(5) if len(x) > 0 else x)
and I tried using the built-in method to accomplish the same thing:
df[COUNTY_FIPS_COL] = df[COUNTY_FIPS_COL].str.zfill(5) # actually slower 😿
Overall, any attempts at optimizations with the data frame .str methods were abandoned as they did not improve performance, and in some cases slowed it down significantly.
Next steps
Although 25 minutes is a lot more manageable than a few hours, and the script is now only run monthly, there are several more steps I am looking into to further optimize this aggregation. If you are reading this and have insight into any of these techniques, let me know in the comments!
🧑💻Parquet instead of 🧑💻CSV: Using the CDC's provided
.parquetfiles instead of the.csvfiles. From what I understand Parquet files are binary/machine-readable, so slightly more difficult to work with (you can't just peek at the contents in VSCode) but more efficient from a memory standpoint. It's unclear if this would be super helpful though, since each file is only used briefly and not continuously opened and manipulated.🐻❄️Polars instead of 🐼Pandas: A more significant change, which would further complicate the codebase, is to introduce a new library for this aggregation called Polars. Its usage is quite similar to Pandas, but it can stream data and manipulate datasets that are larger than the machine's memory. You can load data into a "lazyframe", and perform various aggregations, filters, and calculations, and then the library is clever enough to only deal with the bits of data that are needed for the specified processes. Interestingly, Polars is written in Rust, but the library is available both within Rust AND within Python.
🦀Rust instead of 🐍Python: Maybe out of scope for the project, but of course the only option I've started pursuing (mainly because it was exciting to finally have a tech problem that Rust could help me solve and I wanted to check out what all the buzz was about). Since this aggregation is performed on the local development machine, and is quite distinct from the rest of our Airflow data pipelines, I could refactor this entire script into Rust (using Polars as mentioned above).
Here's a little snippet of what I've gotten working... Be nice Rustaceans! I'm sure this is super inefficient!
fn process_lazyframe_into_by_sex_df(lf: LazyFrame) -> Result<DataFrame, PolarsError> {
    let known_sex_groups = vec!["Male", "Female", "Other"];
    let know_sex_series = Series::new("KNOWN_SEX_GROUP", known_sex_groups);
    let is_known_sex_group = col("sex").is_in(lit(know_sex_series));

    let groupby_cols = vec![col("state_postal"), col("sex"), col("time_period")];

    let df = lf
        // "time_period" as cdc col with only YYYY-MM
        .with_column((col("cdc_case_earliest_dt").str().str_slice(0, Some(7))).alias("time_period"))
        // count every row as 1 case
        .with_column(col("time_period").is_not_null().alias("cases"))
        .with_column(col("hosp_yn").eq(lit("Yes")).alias("hosp_y"))
        .with_column(col("hosp_yn").eq(lit("No")).alias("hosp_n"))
        .with_column(
            col("hosp_yn")
                .neq(lit("Yes"))
                .and(col("hosp_yn").neq(lit("No")))
                .alias("hosp_unknown"),
        )
        .with_column(col("death_yn").eq(lit("Yes")).alias("death_y"))
        .with_column(col("death_yn").eq(lit("No")).alias("death_n"))
        .with_column(
            col("death_yn")
                .neq(lit("Yes"))
                .and(col("death_yn").neq(lit("No")))
                .alias("death_unknown"),
        )
        // only keep Male/Female/Other/Unknown options for sex
        .with_column(
            when(is_known_sex_group)
                .then(col("sex"))
                .otherwise(lit("Unknown")),
        )
        // only keep known postal codes; combine rest as "Unknown" for national numbers
        .with_column(
            when(
                col("res_state")
                    .is_null()
                    .or(col("res_state").eq(lit("Missing")))
                    .or(col("res_state").eq(lit("Unknown")))
                    .or(col("res_state").eq(lit("NA"))),
            )
            .then(lit("Unknown"))
            .otherwise(col("res_state"))
            .alias("state_postal"),
        )
        .groupby(groupby_cols)
        .agg(vec![
            col("cases").sum(),
            col("hosp_y").sum(),
            col("hosp_n").sum(),
            col("hosp_unknown").sum(),
            col("death_y").sum(),
            col("death_n").sum(),
            col("death_unknown").sum(),
        ])
        .collect();

    df
}
So far I've gotten it to the point that it:
Loads all the .csv files in a folder
Combines them into a LazyFrame
Performs the column calculations, manipulations, and aggregations needed for the
SEXtable generations and the produced tables are identical to the full tables produced by our Python code
Run time is well under 5 minutes! Of course, that's only for one of the breakdowns, so it's still not clear if my super newbie Rust code is actually going to save any time or not. I'll follow up once I've had a chance to finish, for now the repo is available on my GitHub. Overall, I've enjoyed messing around in Rust (it feels like when I was learning TypeScript, except I can't just cheat and use any to force things to work when the compiler yells!). And importantly, I've freed up a lot of free time for our small team, allowing us to work on new features for the tracker and waste less time on the waiting for code to run.